
The 2026 TABInsights World’s 100 Best Corporate, Investment and Wholesale (CIW) Banks Ranking reflects an increasingly differentiated banking landscape, where institutions are strengthening their positions through varying combinations of financial performance, brand strength, digital journey and geographic reach. The ranking evaluates 100 institutions across 34 countries and jurisdictions on seven dimensions: corporate clients, digital journey, financial performance, business mandates, employees, brand strength and coverage and risk management.
The 2026 data highlights widening divergence across regional peer groups, with Middle Eastern institutions continuing to lead on efficiency and returns, several Asia Pacific banks strengthening franchise depth and European and North American institutions showing greater variation in performance depending on revenue momentum, cost discipline and organisational complexity.
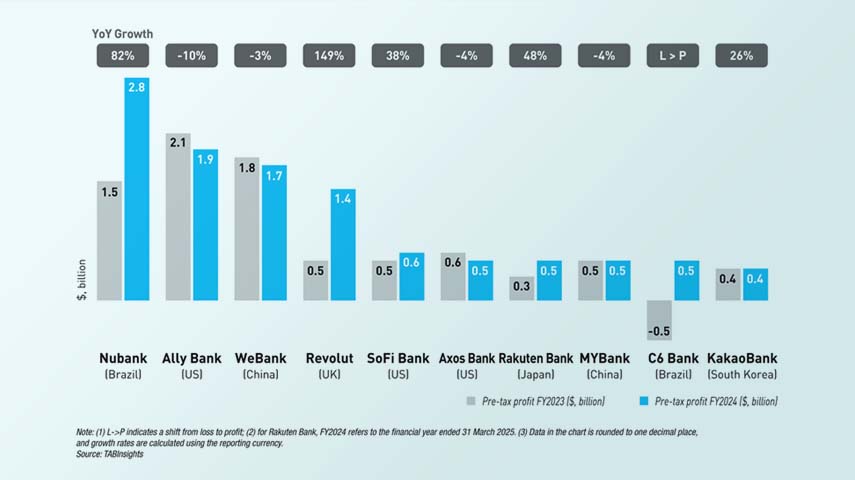
Collectively, the ranked institutions generated approximately $911 billion in CIW banking revenue in FY2025, representing around 37% of total group revenue. Revenue among ranked institutions ranged from $0.3 billion to $78 billion, while pre-tax return on assets (ROA) spanned from 0.2% to 5.4%, illustrating the wide dispersion in scale and financial outcomes across the industry.
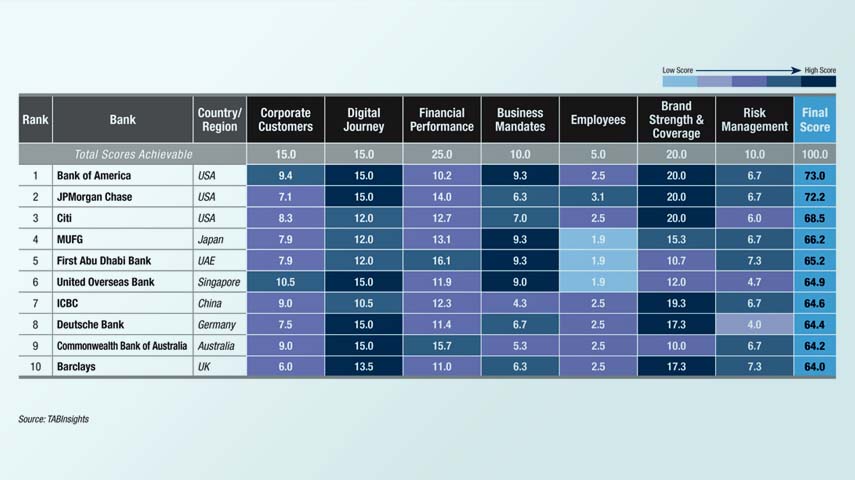
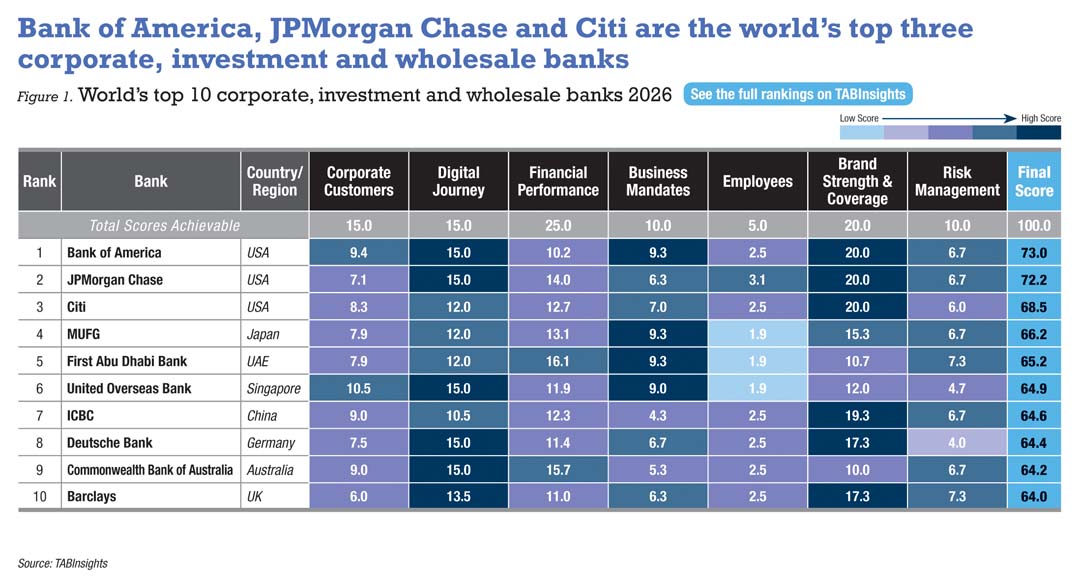
Bank of America, JPMorgan Chase and Citi top the 2026 ranking, followed by Mitsubishi UFJ Financial Group (MUFG), First Abu Dhabi Bank (FAB), United Overseas Bank (UOB), Industrial and Commercial Bank of China (ICBC), Deutsche Bank, Commonwealth Bank of Australia (CBA) and Barclays. The composition of the top tier reflects the diversity of institutional strategies shaping corporate, investment and wholesale banking, spanning globally scaled franchises, regionally concentrated institutions and banks undertaking multi-year transformation programmes.
Improvement across multiple dimensions drives rank movement
Rank movement in the 2026 ranking is driven by improvement across multiple dimensions simultaneously rather than by any single factor. Financial performance improvement is the most consistent driver among the institutions that improved most and in many cases, it is accompanied by digital journey score improvement. Risk management, brand strength and corporate client coverage each played a primary role for specific institutions.
Bank of America moved from rank 2 to rank 1, with improvements across corporate client coverage, business mandate breadth and risk management complementing its already perfect digital journey score. Nearly 70% of corporate clients actively use CashPro Chat for account access, transaction tracking and service resolution. JPMorgan Chase ranks second, maintaining a perfect digital score and processing over $10 trillion daily with a straight-through processing rate of approximately 99% and a leading share in USD clearing. Citi advanced from rank 4 to rank 3, with improvements in business mandate breadth and brand coverage alongside steady financial performance. Barclays entered the top ten for the first time, driven primarily by a substantial improvement in risk management alongside gains in brand strength and corporate client coverage, reflecting progress across multiple dimensions of its multi-year transformation.
The pattern of multi-dimensional improvement extends through the wider ranking. The institutions that moved most significantly share no common geography or business model — what they share is measurable progress across financial performance, digital execution and risk management simultaneously, rather than depth in one area at the expense of others. Al Rajhi Bank illustrates the most complete expression of this pattern: by FY2025, digital channels accounted for approximately 95% of customer interactions and process automation reached nearly 58%, with the CIR falling to 23.3% and revenue growing 26.1%.
The counterpart to this story is a group of established banks being outpaced as the competitive benchmark moved. China Construction Bank (CCB) fell from rank 9 to rank 28 and Agricultural Bank of China from rank 18 to rank 35, where the declines reflect genuine underlying financial deterioration. CCB recorded a 0.1% contraction in CIW revenue in FY2025, following a 4.6% decline the prior year, with a CIW revenue CAGR of -11.0% over FY2021 to FY2024 and pre-tax ROA falling from 0.6% in FY2024 to 0.5% in FY2025. Agricultural Bank of China recorded a CIW revenue contraction of 5.3% in FY2025 alongside a CIR deterioration from 30.3% in FY2024 to 32.5% in FY2025 and ROA declining from 1.0% in FY2024 to 0.8% in FY2025. Bank of China fell from rank 17 to rank 27, with ROA slipping from 0.9% in FY2024 to 0.8% in FY2025 and digital active penetration estimated at 55%, below the digital adoption levels of the ranking’s biggest improvers. Across all three institutions, the pressure reflects interest margin compression, slower corporate lending growth and limited progress in expanding digital engagement with corporate clients.
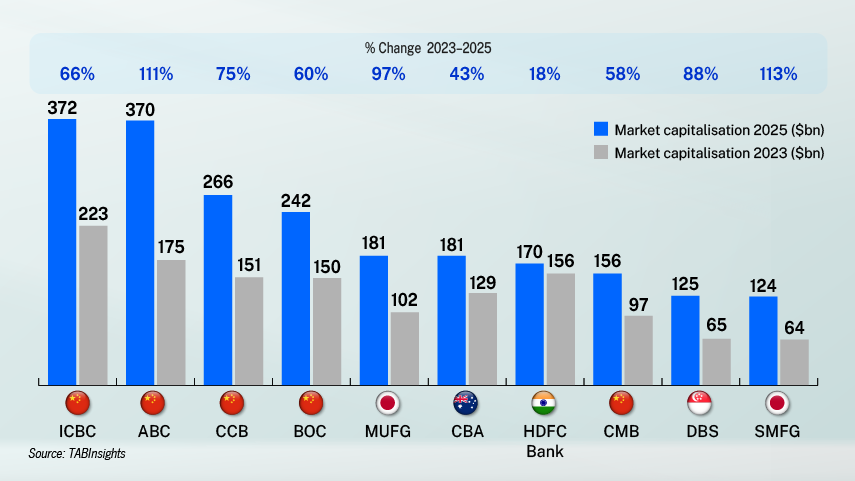
ICBC maintained stronger relative standing at rank 7, supported by a digital score improvement and revenue growth of 4.6% in FY2025, though ROA fell from 1.3% in FY2024 to 1.0% in FY2025 as peer improvement outpaced it. The group retains substantial asset scale and brand coverage, but these structural advantages are not currently translating into the breadth of improvement across dimensions that competitive standing in this ranking requires.
Revenue concentration persists at the top while competitive capability broadens across the ranking
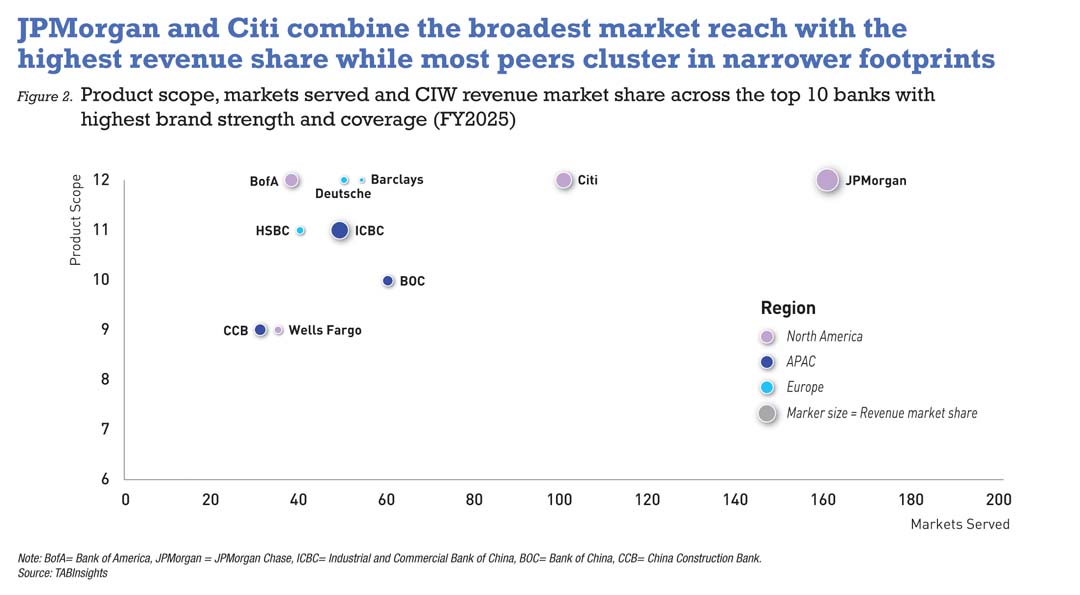
Brand strength is assessed across revenue market share, number of markets served and product scope. Institutions below the top tier are closing the gap in market presence and product coverage while revenue concentration at the very top remains structurally unchanged. European and Asia Pacific institutions recorded the strongest improvements in this dimension, reflecting expanded market disclosure and broader product coverage in this edition’s assessment. HSBC recorded the sharpest decline among top-ranked institutions as peers expanded their relative positions. Deutsche Bank and Barclays each strengthened their standings, reflecting sustained franchise investment within defined geographic perimeters.
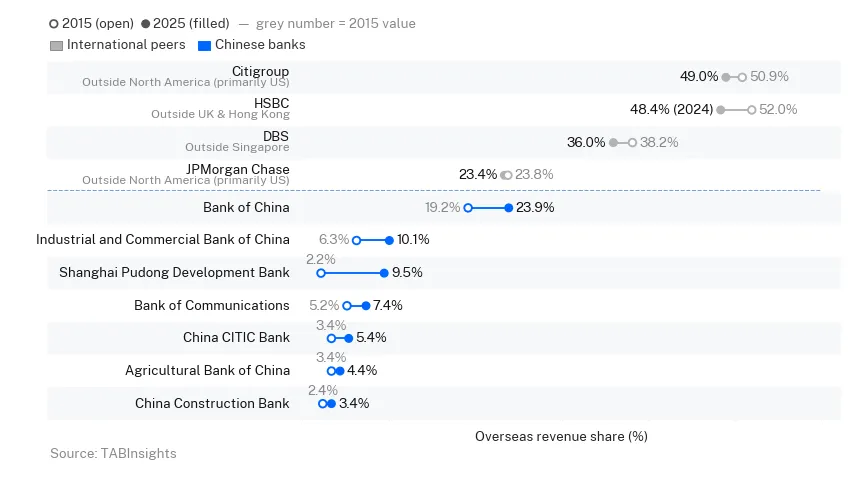
Revenue concentration at the global level has not shifted materially from 2025. JPMorgan leads in revenue market share at 4.0%, with its Payments franchise serving clients in over 160 countries across more than 120 currencies. The five American institutions collectively account for 11.0% of global CIW revenue and the six Chinese mainland institutions approximately 9.5%. This concentration reflects two distinct structural advantages that geographic expansion alone cannot replicate. For American banks, it reflects the revenue depth of the world’s most liquid capital and transaction banking markets. For Chinese banks, it reflects the scale of domestic corporate financing activity — Agricultural Bank of China at 17 markets generates a 1.9% revenue share and China Merchants Bank at 5 markets generates 1.0% — driven by balance sheet scale rather than market breadth.
The Standard Chartered and JPMorgan comparison illustrates why market count and revenue share tell different stories. Both have broad geographic footprints, Standard Chartered across 70 markets and JPMorgan across more than 160, yet generate revenue market shares of 0.6% and 4.0% respectively. Standard Chartered covers 11 of 12 product categories, so the difference is not a function of product capability but of the revenue density of the markets served. JPMorgan’s markets are the world’s deepest fee-generating corridors while Standard Chartered’s are markets where operational presence generates franchise value and client relationships that revenue market share alone does not fully capture. Both approaches are represented in the top 15 of the 2026 ranking, reflecting that competitive standing in this dimension can be sustained through different strategic routes.
Efficiency outcomes diverge as digital deployment matures across regional peer groups
The financial performance data in this edition shows a persistent divergence in efficiency and returns across regional peer groups. Middle Eastern banks recorded stronger CIR improvement in FY2025 than their European and Americas counterparts, driven by a combination of structural market advantages and, in specific cases, significant operational transformation. The drivers of this divergence differ by region and identifying them matters because it determines whether the gap is structurally durable or addressable through operational change.
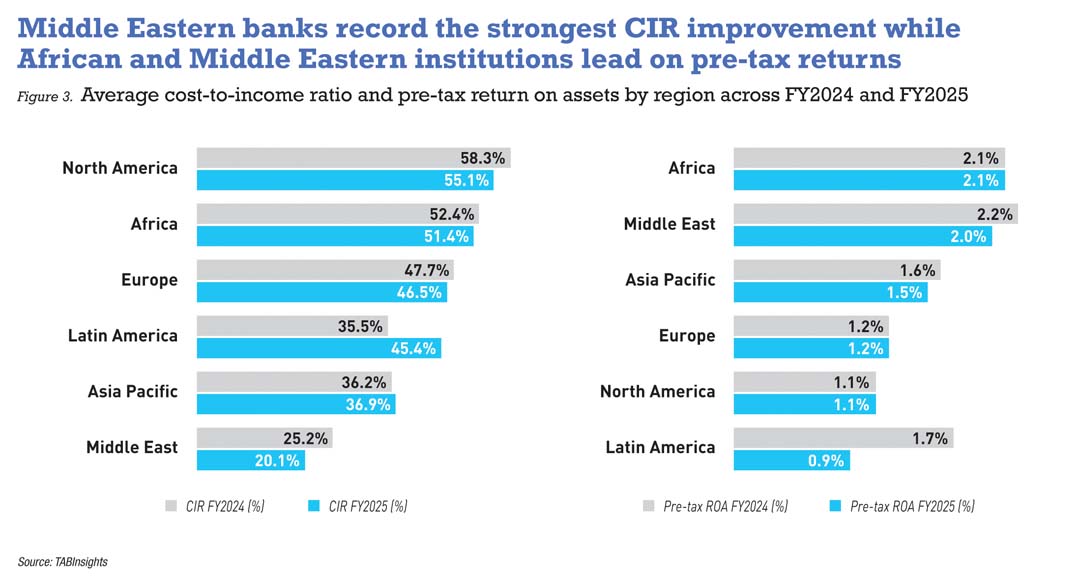
Middle Eastern banks record the strongest efficiency metrics in the ranking. FAB posted a CIR of 15.0% and pre-tax ROA of 2.6% with CIW revenue growing 14.3% in FY2025, as revenue growth outpaced cost growth within a franchise anchored in the gulf cooperation council (GCC) and selectively expanded internationally. Saudi National Bank posted a CIR of 12.3% and pre-tax ROA of 2.3% with revenue up 14.6% in FY2025 and Emirates NBD recorded a CIR of 10.4% and pre-tax ROA of 2.4% in FY2025. Al Rajhi Bank recorded the most significant CIR improvement in the group, from 30.6% in FY2024 to 19.0% in FY2025, where structural market advantages provided the foundation and digital transformation delivered additional operational efficiency gains discussed in the preceding section. The common thread across the group is the structural advantage of concentrated domestic franchises, government-linked balance sheet flows and low-cost deposit bases. These are conditions that generate efficiency levels through market structure rather than operational programmes and they explain why the improvement sustained by Middle Eastern banks in FY2025 is difficult to replicate through cost management alone in more complex, multi-geography institutions.
Asia Pacific banks demonstrate that comparable efficiency outcomes can be achieved through a different mechanism. Kotak Mahindra Bank recorded a pre-tax ROA of 3.1% and CIR of 25.0% in FY2025, reflecting the compounding effect of improving asset quality and disciplined cost management within a competitive private sector. Techcombank in Vietnam recorded a pre-tax ROA of 2.4% in FY2025 with its CIR improving from 39.1% in FY2024 to 28.2% in FY2025, driven by revenue growth of 8.0% in FY2025, reflecting the maturation of Vietnam’s corporate banking market into a deeper institutional franchise. Across the Asia Pacific peer group, efficiency reflects operational discipline and portfolio quality improvement rather than structural funding advantages. The Asia Pacific versus Europe CIR gap narrowed modestly in FY2025, as several institutions across the region continued to improve, though a meaningful differential remains.
The European picture shows the widest internal variation and the clearest illustration of why structural simplification produces more durable efficiency gains than cost management programmes alone. BBVA at CIR 28.2% and pre-tax ROA 1.8% in FY2025 and Intesa Sanpaolo at CIR 32.2%, pre-tax ROA 2.4% and revenue growth of 21.8% in FY2025 are the strongest performers in the group. Both have concentrated their corporate and wholesale franchise in markets with stronger nominal growth dynamics, allowing revenue to grow faster than costs. By contrast, UBS at a CIR of 74.5%, Societe Generale at 62.1%, Credit Agricole at 58.2% and ING at 54.7% each reflect the cost base of diversified structures where revenue growth has been insufficient to reduce the ratio meaningfully. The distinction between these institutions and the European outperformers is not primarily one of digital investment or cost discipline but of operating model complexity and the degree to which the franchise has been concentrated around areas of genuine competitive advantage.
North American institutions show that within a single region, the efficiency gap between institutions can be as wide as the gap between regions. Toronto-Dominion Bank’s CIR improved from 76.5% in FY2024 to 72.1% in FY2025 but remains the highest in the region alongside a pre-tax ROA of 0.3% in FY2025, reflecting regulatory remediation costs that continue to structurally elevate the cost base. JPMorgan at CIR 48.7% and pre-tax ROA 1.9% in FY2025, and BNY at CIR 51.3% and pre-tax ROA 1.8% in FY2025, represent the stronger end of the peer group. Wells Fargo’s CIR deteriorated from 47.4% in FY2024 to 49.7% in FY2025 alongside a revenue decline of 2.8%, illustrating the cost pressures that emerge when revenue growth stalls. RBC, Scotiabank and Bank of Montreal each improved their CIR through revenue growth rather than cost reduction — RBC most significantly from 58.8% in FY2024 to 47.0% in FY2025 on revenue growth of 18.5% — indicating that the efficiency gains are durable only as long as revenue momentum is sustained.
African banks generate pre-tax ROA metrics that compare favourably with many Western peers, with transaction banking embeddedness a primary driver. Standard Bank derives 57.9% of CIW revenue from transaction banking and posts a pre-tax ROA of 2.5% and CIR of 48.0% in FY2025. FirstRand records the strongest returns at pre-tax ROA 3.2%, though its CIR deteriorated from 48.6% in FY2024 to 50.8% in FY2025 on revenue growth of only 0.6%, indicating that return strength was sustained by asset quality rather than cost efficiency. Absa’s CIR improvement from 67.4% in FY2024 to 48.8% in FY2025 on revenue growth of 9.1%, and Nedbank’s CIR deterioration from 44.9% in FY 2024 to 58.0% in FY2025 on revenue growth of 0.5%, together reinforce that revenue growth is the primary determinant of efficiency trajectory in this market.
Latin America does not support a regional conclusion, but the contrast is instructive. Itaú Unibanco improved its CIR from 36.6% in FY2024 to 31.1% in FY2025 on revenue growth of 7.9%, placing it among the more efficient institutions in the ranking at a pre-tax ROA of 2.1%. Banco do Brasil recorded a CIR deterioration and negative pre-tax ROA driven by one-off items against revenue growth of 9.7% in FY2025, pointing to portfolio composition and franchise management rather than the operating environment as the differentiating variable.
Across all regional peer groups, durable financial performance improvement occurs where the mechanism of change is structural rather than cyclical. The institutions where improvement stalled or reversed shared a common characteristic: the operating model remained unchanged while revenue growth moderated.
Execution, not investment, defines the 2026 divide
The 2026 ranking highlights one key finding: institutions that gained ground did so by translating prior investment into measurable financial outcomes across multiple dimensions, while those that lost ground failed to match the pace at which the competitive benchmark moved.
Revenue concentration at the top has not changed, but the competitive field below is more contested than the prior year. European and Asia Pacific institutions recorded the strongest improvements in brand coverage and product scope, while several large Chinese banks recorded their most significant relative declines as revenue contracted and peers improved faster. In a ranking where the benchmark moves each year, standing still is equivalent to falling behind.
The efficiency gap between Middle Eastern banks and Western peers widened in FY2025, driven by structural advantages that cost management programmes alone cannot replicate. Western institutions making durable progress have simplified their operating models and concentrated their franchises around areas of genuine competitive advantage.
View the latest rankings here.
.webp)

.png)